In the lungs, oxygen pressure is high. As blood moves through the body, pressure falls and hemoglobin releases some of its oxygen. The same protein loads and unloads oxygen. Its S-shaped binding curve shows how one change in pressure can do both.
The catalog also includes Nehal Udyavar and Newt Interactive’s The Story of Hemoglobin, which explores the protein’s structure and oxygen binding. Hemoglobin Handoff focuses on a different experiment: one pressure dial connected to a live saturation curve, so the pressure-to-occupancy change and cooperative release stay visible.
What does the curve measure?
Hemoglobin has four heme sites that can bind oxygen. Oxygen partial pressure, or pO2, describes the pressure from oxygen dissolved in blood. Saturation is the fraction of hemoglobin’s available binding sites occupied by oxygen. It is not the amount of oxygen in a volume of blood. Oxygen content also depends on how much hemoglobin is present and on oxygen dissolved in the blood.
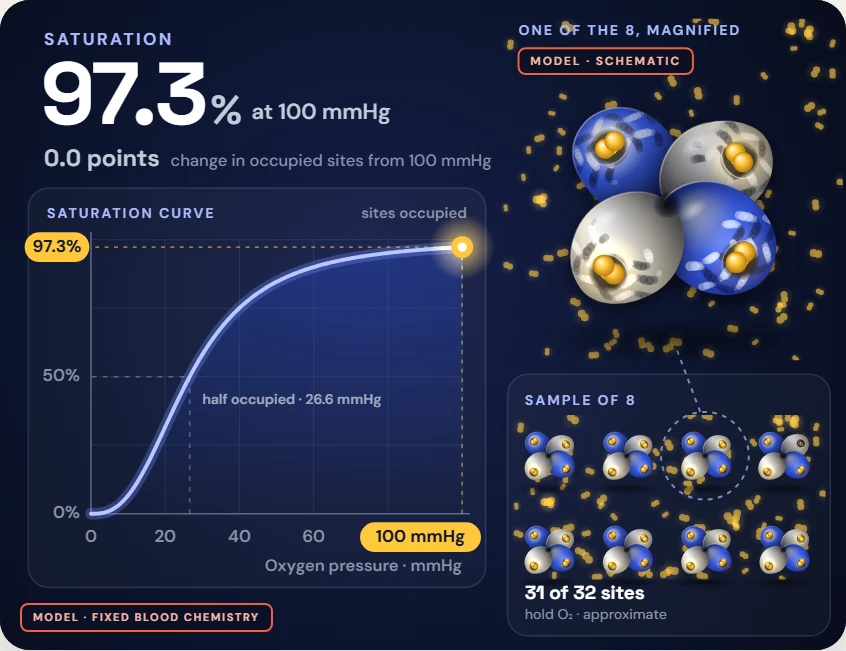
In the reference curve here, pO2 near 100 mmHg gives about 97% saturation. At 40 mmHg, the model gives about 75%. Those are illustrative lung-side and mixed-venous reference points. The 22 percentage-point change is a change in modeled binding-site occupancy; it is not a measure of how much oxygen a particular person or tissue received.
Why is the curve an S?
When oxygen binds, hemoglobin changes shape. That change makes oxygen binding at the other sites more favorable. As oxygen binds, hemoglobin shifts toward a higher-affinity relaxed state. When pressure falls and oxygen leaves, the balance shifts back, making further release easier. This cooperative binding is why the curve rises gently at low pressure, climbs steeply through its middle, then levels off as sites fill.
A compact way to draw the relationship is the Hill equation: S = pO2n / (P50n + pO2n). Here P50 is 26.6 mmHg, where the model reaches 50% saturation, and n is 2.7. The Hill equation is an empirical curve description. Its non-integer coefficient summarizes the steepness associated with cooperativity; it does not mean 2.7 oxygen molecules bind at once or show every molecular step.
Predict
Before moving the pressure dial, point to where you expect saturation to change fastest: near 100, near 40, or between them? What do you predict will happen to the occupied fraction when pressure drops from 100 to 40 mmHg?
Try
Open Hemoglobin Handoff, start at 100 mmHg and read the saturation. Drag oxygen pressure to 40 mmHg, then to the half-saturation point at 26.6 mmHg. Keep your eye on the moving marker and the occupied fraction. Change pressure only; this comparison holds the model’s blood chemistry fixed.
Notice
The marker moves along one curve, but equal pressure steps do not cause equal saturation changes. Near the high-pressure end, the line is flatter. Through the middle, it is steeper. Near 40 mmHg, this reference model changes from about 97% to about 75% saturation. That is a difference in percentage points of binding-site occupancy, not a percentage of oxygen content.
Why this is a model
The curve uses adult hemoglobin at reference conditions: 37°C, pH 7.4, and carbon-dioxide partial pressure of 40 mmHg. Real blood chemistry can shift the curve. Temperature, pH, carbon dioxide, and other effectors matter, and pressures vary across tissues. Forty mmHg is a mixed-venous blood reference, not a pressure shared by every cell. The display is an educational equilibrium-style model, not a molecular simulation, a clinical measurement, or guidance for interpreting a device or blood test.
Try it yourself in Hemoglobin Handoff.


Sources & further reading
Make the next question an experiment.
Browse independent creators who make big ideas visible.
Find an explainer