Biology · interactive
Why does oxygen let go?
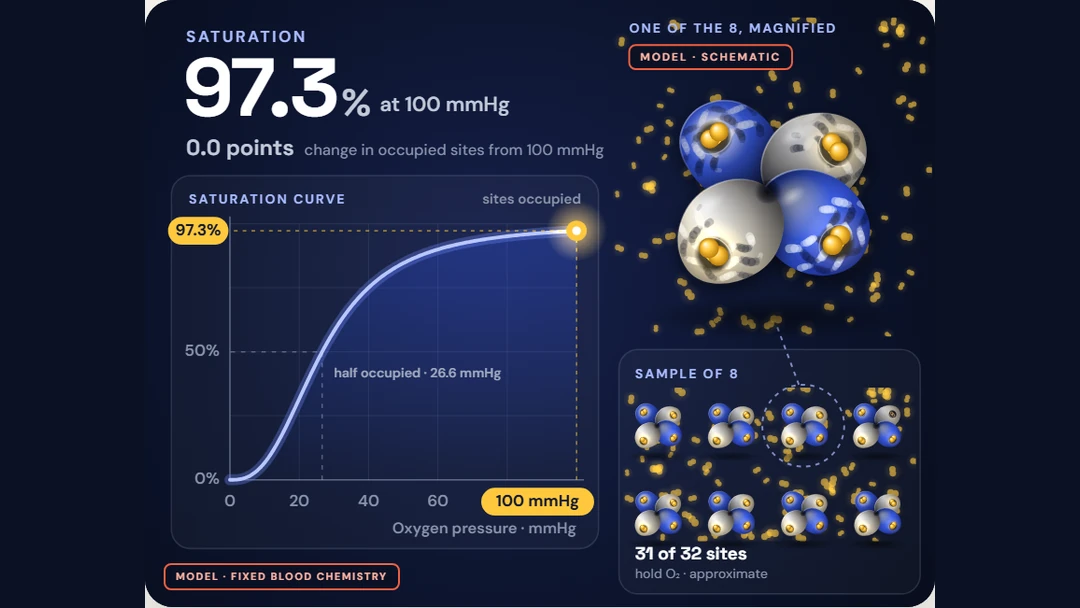
Left: the saturation curve, with your pressure as the marker. Right: one sampled molecule magnified (schematic) above a sample of eight, filled to match the curve. All of it follows the knob you turn.
1 See
In the lungs nearly every hemoglobin binding site holds oxygen. So why does so much let go when the pressure falls toward 40 mmHg?
2 Change
3 Understand
Model notes and sources
Empirical Hill fit of hemoglobin’s oxygen-equilibrium curve: S = pn / (P50n + pn), with p the oxygen partial pressure in mmHg (0–100), P50 = 26.6 mmHg and n = 2.7. S is the share of hemoglobin binding sites occupied across a population of molecules. It gives 97.3% at 100 mmHg, 75.1% at 40 mmHg and exactly 50% at 26.6 mmHg, so lowering the pressure from 100 to 40 mmHg lowers occupancy by about 22.2 percentage points. That is a change in occupied sites. It is not a volume of oxygen and not the oxygen delivered to any tissue.
Fixed reference chemistry: adult hemoglobin at 37 °C, pH 7.4 and PCO₂ 40 mmHg, with one P50 and one Hill coefficient across the whole dial. The Hill equation is a curve fit and a summary of cooperativity: n = 2.7 does not mean 2.7 oxygen molecules bind at once, and this page is not a molecular kinetic simulation. Not modeled: pH and the Bohr effect, CO₂, temperature, 2,3-BPG and other effectors, hemoglobin variants, anemia or hemoglobin concentration, dissolved oxygen, blood flow, diffusion, changing capillary conditions and transit time. Real tissue pressures and unloading vary. 40 mmHg is a reference for mixed-venous blood returning from the body’s tissues, not the pressure inside every cell.
The molecule is a schematic, not measured atomic structure: four subunits (two alpha, two beta) with one heme site each. Its shape moves a quarter of the way from a tense to a relaxed form with each bound oxygen; the rotation, cavity and pocket changes are exaggerated so you can see them. The sample of eight molecules is approximate. How many of its 32 sites hold oxygen follows the curve (S × 32, rounded); which sites hold it is an illustrative allocation that keeps molecules mostly full or mostly empty, as cooperative binding tends to. It is not a measured or simulated distribution of binding states. This is an educational equilibrium model. It is not medical advice, a pulse-oximeter or blood-gas reading, a device calibration, or a prediction for any patient or tissue.
Sources: OpenStax, 22.4 Gas Exchange; OpenStax, 22.5 Transport of Gases; NCBI Bookshelf, Oxygen Transport (Regulation of Tissue Oxygenation); Marden et al., PNAS, A signature of the T → R transition in human hemoglobin; Bird et al., Influence of High Hemoglobin-Oxygen Affinity on Humans During Hypoxia.
An ExplainerTools Original. Concept inspired by Nehal Udyavar / Newt Interactive’s The Story of Hemoglobin. The pressure dial and live saturation curve here are independently built.