Roads · interactive
Why do traffic jams appear out of nowhere?
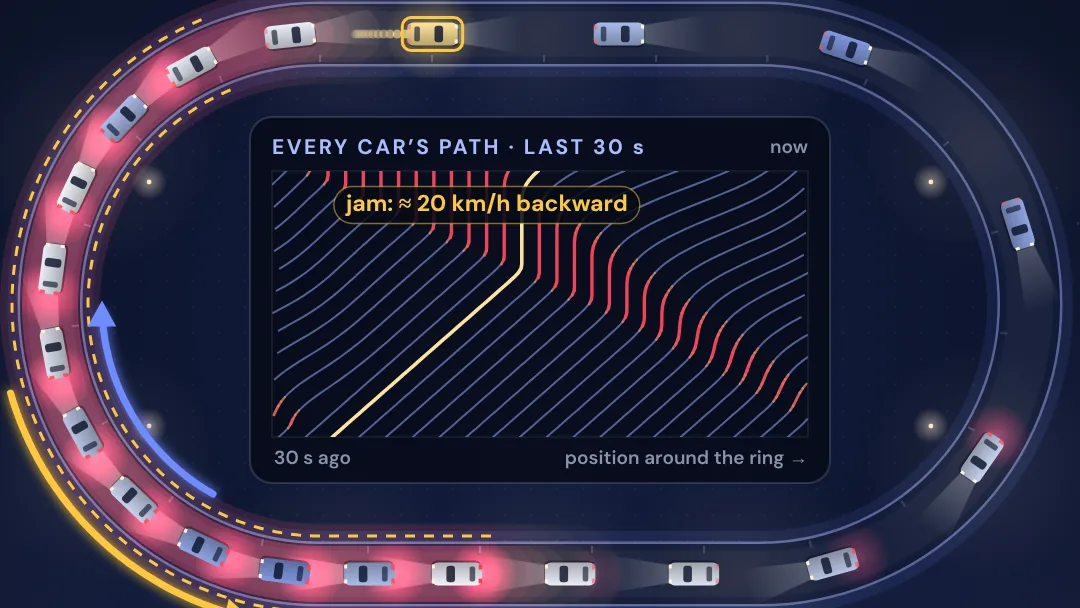
Cars drive clockwise round a 230 m ring, the size of the circuit in the 2008 Nagoya experiment. Red road: cars slowed or stopped. Inside the ring, each line is one car's path over the last 30 seconds, with now at the top. Tap any car to make it brake.
1 See
Twenty cars, one lane, nothing in the way. One driver taps the brakes for a second. Why does the whole ring end up in stop-and-go traffic?
2 Change
3 Understand
Watch the full 41-second film for the longer story.
Model notes and sources
Road and drivers. One lane, 230 m round, the length of the circuit in Sugiyama and colleagues’ 2008 experiment. Every car is 4.5 m long, every driver is the same, and nobody overtakes. Each driver follows the Intelligent Driver Model (Treiber, Hennecke & Helbing 2000): acceleration = a[1 − (v/v0)4 − (s*/s)2], where v is the car’s speed, s the gap to the car ahead, and the gap the driver wants is s* = s0 + vT + vΔv/(2√(ab)), with Δv the speed at which they are closing in. Fixed values: desired speed v0 = 50 km/h, time gap T = 0.8 s, top acceleration a = 2.0 m/s², comfortable braking b = 1.5 m/s², gap when stopped s0 = 3.5 m.
Reaction time. Each driver acts on what they saw 0.5 s earlier, extrapolated to now at constant speed, the temporal anticipation of Treiber, Kesting & Helbing (2006). Braking is capped at 9 m/s². The model steps every 0.05 s. A brake tap is 2.5 m/s² of braking, held until the car has shed the chosen speed: 11 km/h (1.2 s) in the film.
What the model finds. Evenly spaced cars settle at a speed set by their gaps: 42 km/h with 10 cars (18.5 m gaps), 16 km/h with 20 cars (7 m gaps), 11 km/h with 22. With 10 cars the tap fades: the car behind slows by about 5 km/h, the next by about 3, and a few cars back there is no trace. With 20 cars it deepens instead: about 12 s after the tap a car stops, and the stop-and-go jam that forms keeps 11 of the 20 cars standing at any moment. The jam drifts backward at 19.6 km/h, measured from a 110-second run (the film rounds it to 20 km/h); the tool measures the front of the current jam live. In this model, even flow breaks down whenever the gaps are under about 11 m (15 or more cars on this ring); with 15 cars it takes about three minutes.
Real traffic. Sugiyama et al. put 22 cars on a 230 m circuit and asked the drivers to cruise at about 30 km/h. With no bottleneck, small differences in spacing grew until a stop-and-go jam formed and traveled backward at roughly 20 km/h, the speed jams are measured moving on real highways. The model’s drivers keep longer gaps than those test drivers, so at 22 cars they cruise more slowly (11 km/h) before the jam forms, but the jam and its backward speed come out the same.
Drawing choices. The ring is drawn as a stadium shape. Distances along it and car lengths are to scale; car width is not. The road glows amber where cars run slower than they would with even spacing, and red where they stop. Time-lapses are labelled on the stage (the film uses ×2 and ×5, the tool ×3). In the chart inside the ring, left to right is position around the ring and time runs down from now, so a car’s line leans one way and the jam’s band leans the other.
Left out. More lanes, lane changes, merges, different drivers and vehicles, random driver mistakes (here the only disturbance is the one tap), misjudged distances, and looking further than one car ahead. On real roads the first slowdown might come from a merge, a lane change or a driver braking. It is a model, not a traffic forecast. An earlier ExplainerTools version of this tool used the Nagel–Schreckenberg cellular automaton (7.5 m cells, speeds in whole cells per second). It also makes jams that drift backward, but it cannot show a gentle brake tap or brake lights, so this version uses a smooth car-following model.
Sources: Sugiyama et al. (2008), Traffic jams without bottlenecks: experimental evidence for the physical mechanism of the formation of a jam, New Journal of Physics 10, 033001; Treiber, Hennecke & Helbing (2000), Congested traffic states in empirical observations and microscopic simulations, Physical Review E 62, 1805; Treiber, Kesting & Helbing (2006), Delays, inaccuracies and anticipation in microscopic traffic models, Physica A 360, 71–88; Intelligent driver model; Traffic wave; Nagel & Schreckenberg (1992), A cellular automaton model for freeway traffic.
An ExplainerTools Original.