In fiscal 2026 the United States paid $1.14 trillion in interest on its debt, more than the $916 billion it spent on the military. Fifteen years ago the interest bill was about a fifth of that. Why does the pile grow faster every year?
Try it yourself in Debt Snowball: turn the interest rate, growth and the spending gap and run the pile from 2026 to 2056.
The machine
Taxes bring in about $5.4 trillion a year. Before anything else, the government pays the interest on what it already owes: $1.1 trillion comes off the top and goes to the lenders. That leaves $4.3 trillion for programs: Social Security, Medicare, Medicaid, the military, everything else. But programs cost $6.3 trillion, so the box is $2 trillion short. The shortfall is borrowed by selling Treasury bonds, and every dollar borrowed is added to the pile, which stood at about $32 trillion held by the public at the end of 2026, roughly the size of the whole economy.
The first engine: the gap
Spend more than you take in and the pile grows. That part is ordinary. In the model, spending before interest runs about 2.6% of GDP ahead of taxes, year after year, and that alone adds the better part of a trillion dollars annually.
The second engine: the rate against growth
The pile charges interest, and because interest is paid first, a bigger pile means a bigger first slice next year, less left for programs, and more borrowing. So the pile grows by the gap plus the interest on itself. The economy grows too, which is what pays the taxes, so the question is which grows faster: the interest rate on the pile, or the economy. Today the average rate on the debt is about 3.5% and the economy grows about 4% a year in dollar terms, which just about holds the ratio steady before the gap is counted. Raise the rate two points, to 5.5%, and the pile outgrows the economy on its own. In the model, interest reaches nearly $4 trillion by 2036, almost half of all taxes, and the pile passes 240% of GDP by 2056. Set the gap to zero with the rate still above growth and the ratio keeps climbing anyway; that is the snowball with nothing feeding it but itself.
The same machine as a company
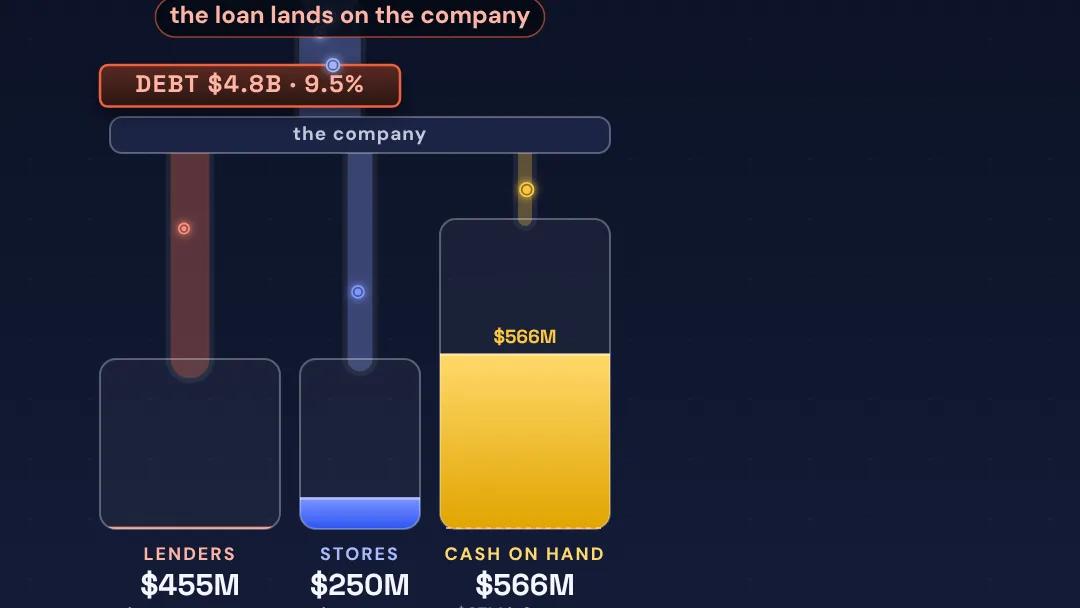
This is Toys “R” Us with a printing press. A company with debt it cannot outgrow runs out of cash and the lenders take over. A country that borrows in its own currency cannot run out of dollars in the same way, which is why the ending is different: higher taxes, less spending, inflation that shrinks the pile in real terms, or lenders demanding higher rates, which feeds the second engine. Ray Dalio's How the Economic Machine Works calls the painful version a deleveraging and the gentle version a beautiful one; the model here only shows how fast the pile grows under each setting, and leaves the ending to you.
The tool keeps taxes and spending at fixed shares of GDP and applies one average rate to the whole pile at once; in reality new rates reach the pile as old bonds roll over, which takes years. The 2036 figures are the model's projection at a 5.5% rate, not a forecast. The film's footage is credited on screen; the machine, pipes and numbers come from the model.
Sources: Congressional Budget Office, Monthly Budget Review: September 2026; American Action Forum on the Treasury's final Monthly Treasury Statement for fiscal 2026; Wikipedia, Debt-to-GDP ratio; Ray Dalio, How the Economic Machine Works.
Sources & further reading
Make the next question an experiment.
Browse independent creators who make big ideas visible.
Find an explainer