Topic guide · Business and money
How did $5 billion of debt sink Toys “R” Us?
Because the profit was spoken for before it arrived. In 2005, buyers paid $6.6 billion for the company, mostly with borrowed money, and the loan was put on Toys “R” Us itself. In its last full year, fiscal 2016, the stores earned $792 million before interest, the company reported. Interest took $457 million and keeping stores fresh took $252 million. That left almost nothing. When sales dipped, the profit fell but the interest did not, and in September 2017 the company filed for bankruptcy.
- Profit before interest
- $792M
- Interest
- $457M
- Store upkeep
- $252M
- Net result
- −$36M
Company figures · fiscal 2016 Adjusted EBITDA, interest expense, capital expenditures and net loss from the fiscal 2016 results release.
Interactive · ExplainerTools
Buyout Lab
Move the debt, the rate and the sales. Watch profit pour in, interest and upkeep take their share, and the cash tank fill or drain year by year.
Model · fiscal 2016 figures, replayed
What is a leveraged buyout?
A buyer purchases a company mostly with borrowed money, then makes the company itself carry the loan. That is a leveraged buyout. In 2005, KKR, Bain Capital and Vornado bought Toys “R” Us for $6.6 billion, Retail Dive recounts, leaving the retailer with roughly $5 billion of debt that cost about $400 million a year to service.
The buyers put up a slice of the price. The rest came from lenders, and the stores had to earn the interest every year, on top of everything it costs to run a toy chain.
Why was $792 million not enough?
Follow fiscal 2016, the last full year before the bankruptcy. The company’s results release reports net sales of $11.54 billion and Adjusted EBITDA, the profit before interest, taxes and wear, of $792 million.
Then the fixed bills. Interest expense was $457 million. Capital expenditures, the money that keeps stores fresh and shelves modern, were $252 million. Together they took $709 million of the $792 million. The year ended with a net loss of $36 million.
Buyout Lab draws the same machine. Profit pours in at the top, interest and upkeep take their share through pipes whose width is their size, and whatever is left reaches the cash tank. At the company’s own figures, the tank barely moves.
What happens when sales dip 10%?
Running the stores costs about the same whether they are busy or quiet. In the model, a 10% fall in sales takes the profit before interest from $792 million to about $380 million, because the operating costs stay put. That is the same operating leverage that runs a café.
Interest does not fall at all. The lenders are owed $457 million whatever the stores sold. So the gap between what comes in and what is owed opens fast, and the $566 million of cash the company held drains in a couple of years. Then the lenders take over: that is what a bankruptcy filing means for a company that cannot pay.
Try it: take the debt away, then put it back
- 1 See
Open Buyout Lab at the company’s figures: $4.8 billion of debt at 9.5%, sales as reported. The cash tank holds steady.
- 2 Change
Drag Debt to zero. Interest disappears, and the same stores put more than $500 million a year into the tank.
- 3 Understand
Put the debt back and drag Sales down 10%. Profit before interest halves, interest does not move, and the tank empties by 2019.
What really happened, and what the model leaves out?
Toys “R” Us filed for Chapter 11 on September 18, 2017, with about $5 billion of debt and about $400 million of it due the next year, Fortune reported. The reorganization failed, and the company liquidated its US stores in 2018.
The model keeps the shape and drops the detail. It leaves out taxes, working capital, store closures, asset sales, refinancing and debt repayments, and the real company did not drain in a straight line. The 10% sales drop is a what-if, not the recorded fiscal 2017 result. The film’s footage, a sign coming down in 2018, is by @toysrusarchive, credited on screen; the numbers come from the company’s filings and the model, not from the clip.
Explore by question
A buyout, a bill that never shrinks, and the dip that empties the tank. Each card answers one part of the question.
Buyout Lab
Model · fiscal 2016 figures, replayed
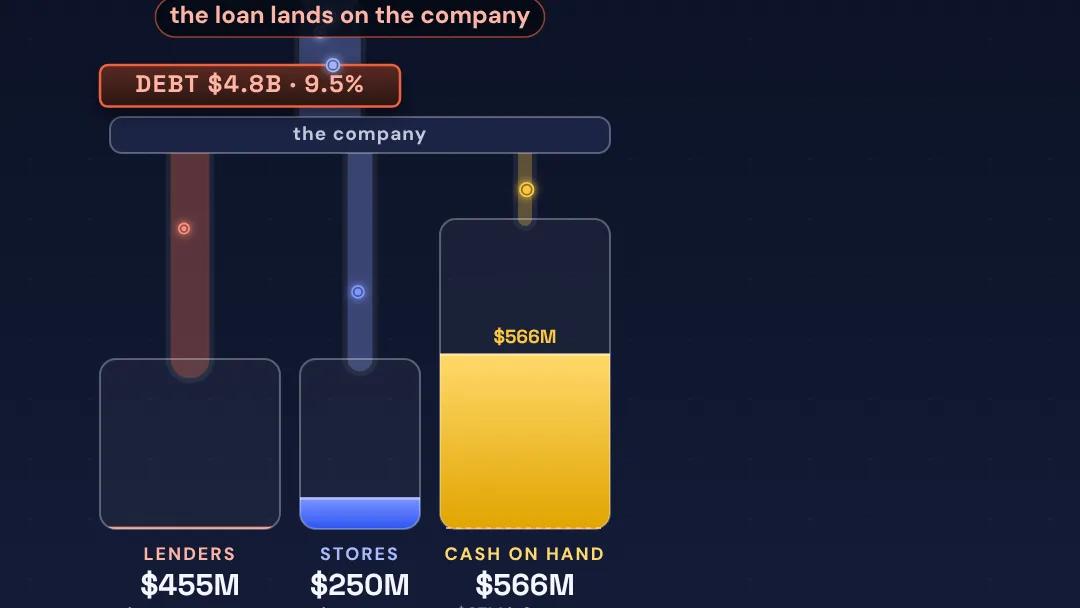 Interactive · Buyout LabHow did $5 billion of debt sink Toys “R” Us?Move the debt, the rate and the sales, and watch the cash tank year by year.
- Short · 39 secondsHow did $5 billion of debt sink Toys “R” Us?The buyout, the interest and the 10% dip, narrated and captioned.
- JournalHow did $5 billion of debt sink Toys “R” Us?In its last full year Toys “R” Us earned $792 million before interest. The 2005 buyout had put about $5 billion of debt on the company, and interest took $457 million of that every year. Drop sales 10% and the arithmetic turns deadly.
The same lever, without the debt
Fixed costs alone make profit swing more than sales. A café shows the lever at its simplest.
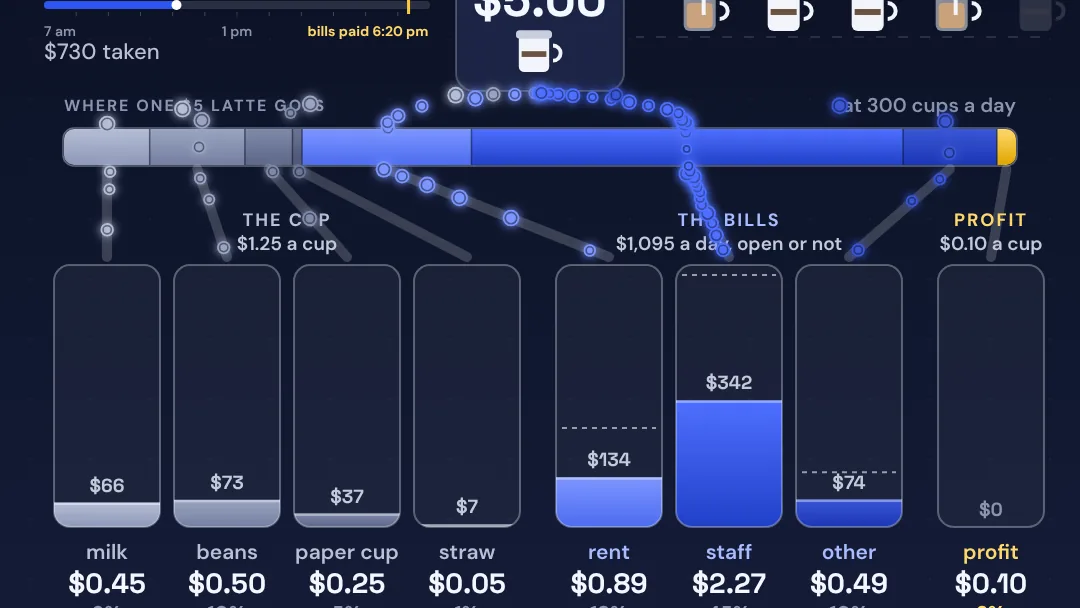 Interactive · Latte LedgerWhy does a $5 latte earn ten cents?One café day: the bills fill first, and 50 more customers turn ten cents a latte into 62.
The same machine, as a country
A government also pays interest first. The difference is what it can do when the gap opens.
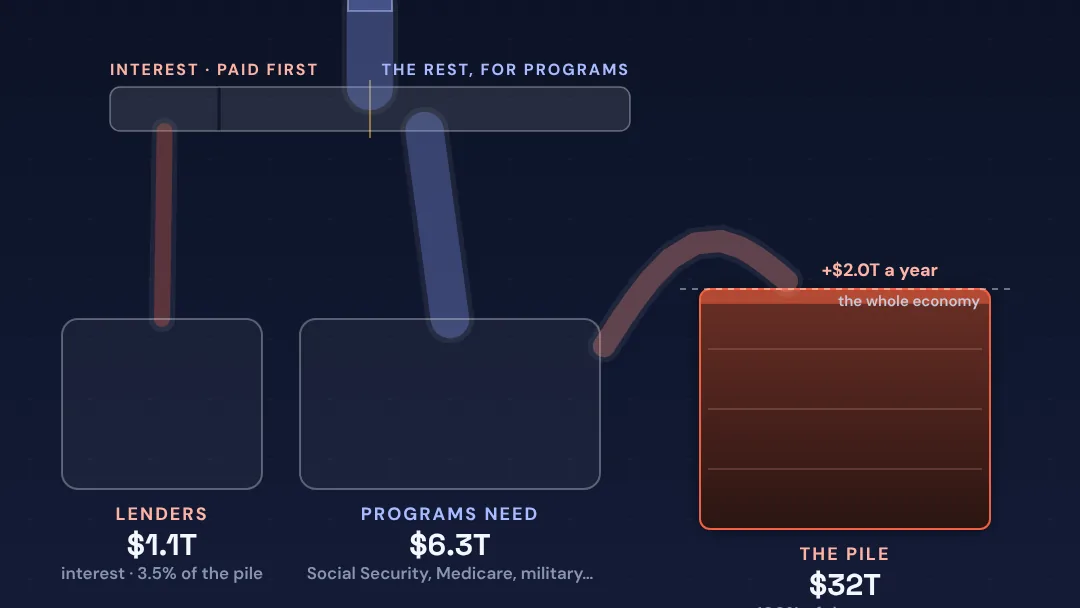 Interactive · Debt SnowballWhy does the national debt snowball?Taxes pour in, interest comes off the top, and the shortfall is borrowed onto a pile that charges interest on itself.
Borrowing you can play
A home loan is the leverage most people know: a fixed payment that does not care how your year went.
- Interactive demoHOME RUN — The Home Loan GamePlay a home-ownership simulation and see whether you can pay the bond off early.by Koshiek Karan
Common questions
Was Toys “R” Us losing money on its stores?
Not before interest. In fiscal 2016 the stores earned $792 million of Adjusted EBITDA on $11.5 billion of sales. After $457 million of interest, $252 million of capital spending and the rest, the year ended $36 million in the red.
Who were the buyers?
KKR, Bain Capital and Vornado Realty Trust, in a 2005 deal valued at $6.6 billion. The debt raised for the purchase stayed with the company.
Why not just pay the debt down?
With what? After interest and upkeep there was almost nothing left each year, and the lenders expected the principal back on a schedule. About $400 million came due in 2018, which is what forced the filing in September 2017.
Is a mortgage the same thing?
In shape, yes: a fixed payment that does not shrink when income does. The difference is scale and who carries it. A buyout puts the loan on the company that was bought, so the stores had to earn the buyers’ interest.
Would the chain have survived without the buyout?
Nobody can rerun it. The model shows one thing clearly: at the same sales, the same stores with no buyout debt add more than $500 million a year to the cash tank instead of draining it. Competition from Amazon and big-box stores was real, and the model does not weigh it.
Sources and credits
- Toys“R”Us, Inc. · Results for fiscal 2016 (PR Newswire) Net sales $11,540M, operating earnings $460M, Adjusted EBITDA $792M, interest expense $457M, net loss $36M, capital expenditures $252M, cash $566M.
- Toys“R”Us, Inc. · Form 10-K for fiscal 2016 (SEC) The annual report behind the results release: the debt, its rates and its maturities.
- Fortune · Toys “R” Us files for bankruptcy September 18, 2017. About $5 billion of debt, with about $400 million due the next year.
- Retail Dive · Inside the 20-year decline of Toys R Us The 2005 leveraged buyout by KKR, Bain Capital and Vornado for $6.6 billion, and the roughly $400 million a year of debt service.
- Toys R Us Archive on TikTok (@toysrusarchive) The sign coming down in 2018, used as a short credited excerpt in the film.
- Buyout Lab · model notesThe equations, the fiscal 2016 inputs and what the model leaves out.
Every creator named here made the work we link to. Listing it does not imply a partnership or endorsement.