Explore interactive ideas in space, science, math, and more. Try a demo, read an interactive article, watch a short video, and follow what makes you curious.
New Originals
Change one thing and see why.
The three newest models, each with a short film. Watch the question, then play with the answer.
Andrew Marsh
Develops browser tools for exploring solar geometry, environmental physics and mathematical form.
3 works in this collection
Start exploring
 ScienceInteractive demo
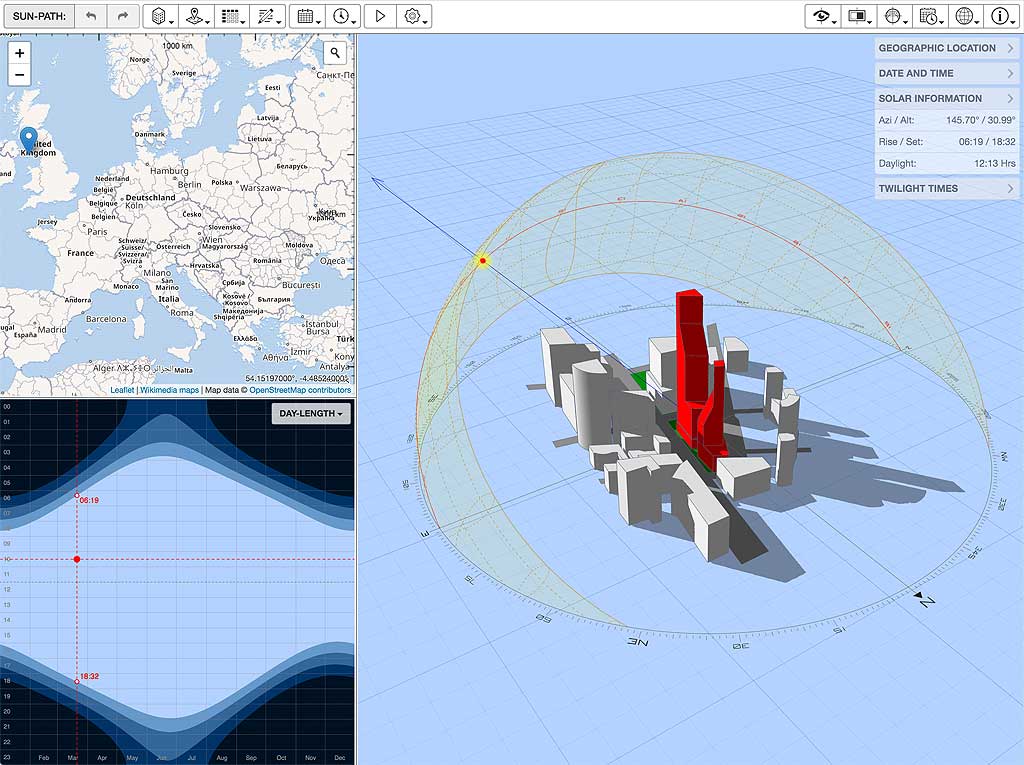
3D Sun-Path
Move the geographic location and date to connect the annual solar path with day length and shadow projections.
 ScienceInteractive demo
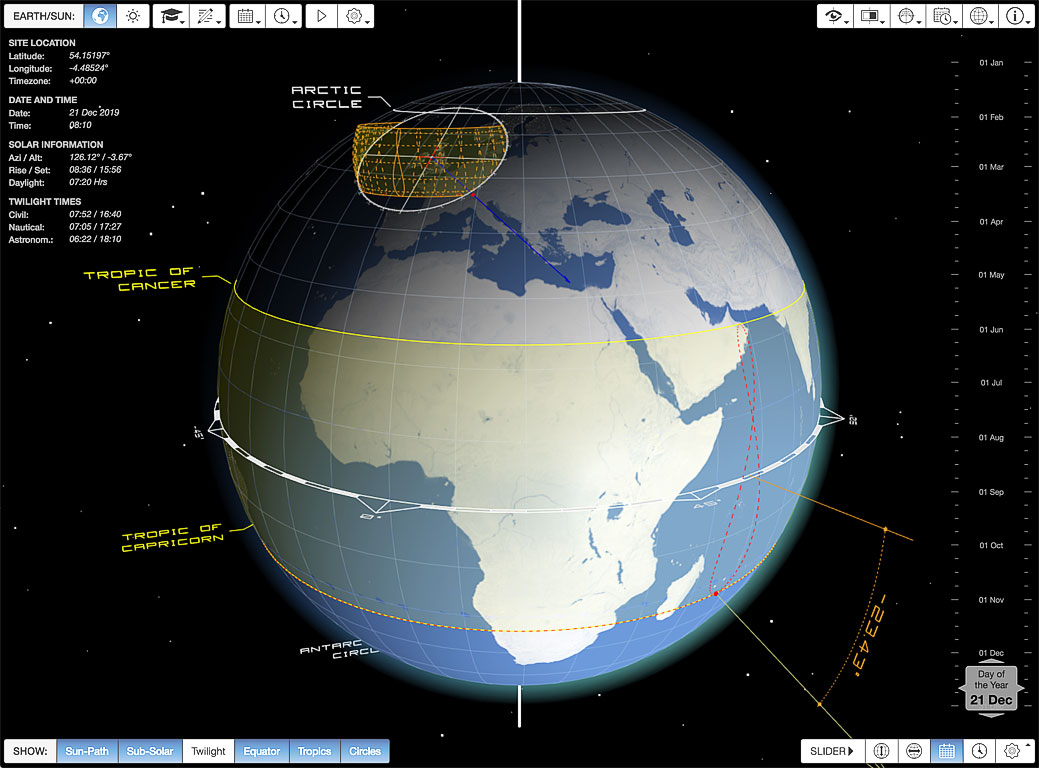
Earth and Sun
 EngineeringInteractive demo
Psychrometric Chart
Works in this collection
Curated works, with credit and links to the originals. This is not a lifetime total.
Showing 3 works in this collection.
- ScienceInteractive demo
3D Sun-Path
Move the geographic location and date to connect the annual solar path with day length and shadow projections.
Sources and dates
- Credit
- Andrew Marsh
- Work page
- Original work ↗
- Listed source
- Catalog source ↗
- Added to collection
- Published
- · Dated source ↗
- Updated
- · Dated source ↗
- Phones
- Phone usability has not been checked.
- ScienceInteractive demo
Earth and Sun
Switch geocentric and heliocentric views, dates and overlays to explore solar motion, twilight and latitude.
Sources and dates
- Credit
- Andrew Marsh
- Work page
- Original work ↗
- Listed source
- Catalog source ↗
- Added to collection
- Published
- · Dated source ↗
- Updated
- · Dated source ↗
- Phones
- Phone usability has not been checked.
- EngineeringInteractive demo
Psychrometric Chart
Toggle chart metrics and humidity representations to explore moist-air properties; optional weather data adds environmental context.
Sources and dates
- Credit
- Andrew Marsh
- Work page
- Original work ↗
- Listed source
- Catalog source ↗
- Added to collection
- Published
- · Dated source ↗
- Phones
- Phone usability has not been checked.
History
Source-backed history from the creator’s own pages and posts: when each work was announced, published or updated. Collection additions are kept separate, because they record our curation, not the creator’s release date.
Announced is the date of the creator’s own post about a work. Published and updated come from the creator’s own page. Each entry links its source.
- Updated
- Dated first-party source ↗andrewmarsh.com
- Updated
- Dated first-party source ↗andrewmarsh.com
- Published
- Dated first-party source ↗andrewmarsh.com
- Published
- Dated first-party source ↗andrewmarsh.com
- Published
- Dated first-party source ↗andrewmarsh.com
About Andrew Marsh
Andrew Marsh creates browser applications and interactive diagrams for environmental analysis and education. His software pages explain the models and document changes.
About this collection
3 works have been curated here. This count describes this collection, not the creator’s lifetime output.
For creators
Is this your work?
We’re building tools for creators to update their own profiles. Join the waitlist, and we’ll email you when they’re ready.
Waitlist only Joining doesn’t claim this profile, verify ownership or change anything on this page.
Follow your curiosity
A collection of small doors into big ideas.
Swipe or scroll for more formats →
Swipe or scroll for more subjects →
Swipe or scroll for more topics →
Make something click.
Made an explainer, or found one you love? Give it a place in the collection.