Engineering · Interactive demo
Psychrometric Chart
Toggle chart metrics and humidity representations to explore moist-air properties; optional weather data adds environmental context.
Created by Andrew Marsh.
What you’ll explore
This interactive demo gives you a visual way into engineering. The key ideas include thermodynamics, humidity, psychrometry.
Continue learning
- Internal Combustion Engine by Bartosz Ciechanowski
- How can a heat pump give more heat than it uses? by ExplainerTools
- Why does a cold glass sweat? by ExplainerTools
- Airfoil by Bartosz Ciechanowski
- Bicycle by Bartosz Ciechanowski
- Mechanical Watch by Bartosz Ciechanowski
Explore interactive ideas in space, science, math, and more. Try a demo, read an interactive article, watch a short video, and follow what makes you curious.
New Originals
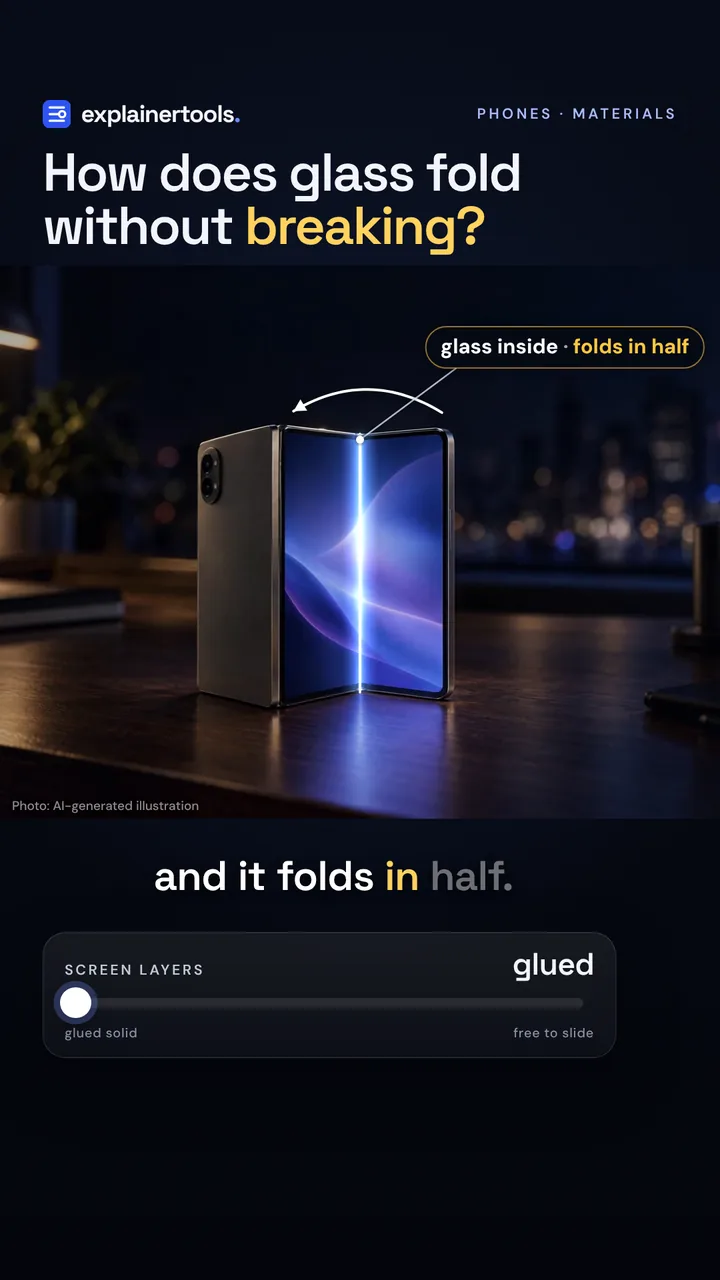
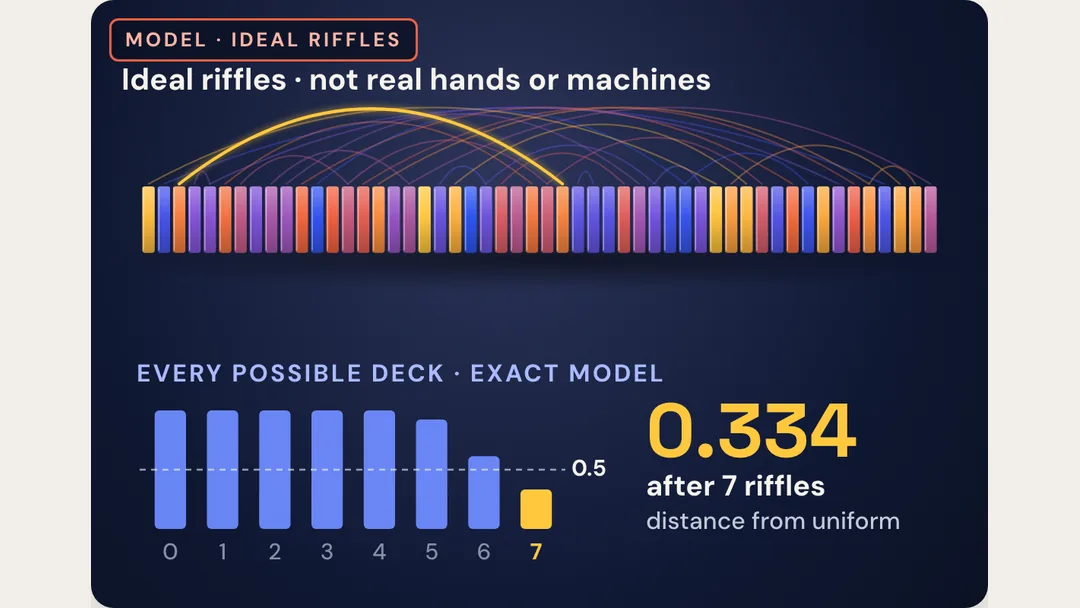
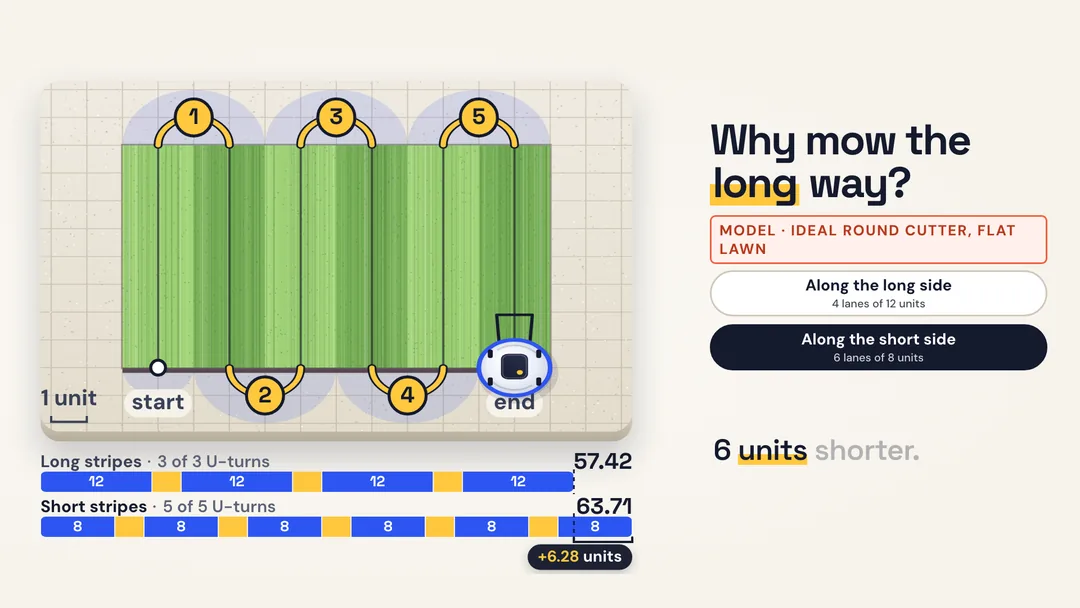
Change one thing and see why.
The three newest models, each with a short film. Watch the question, then play with the answer.
Follow your curiosity
A collection of small doors into big ideas.
Swipe or scroll for more formats →
Swipe or scroll for more subjects →
Swipe or scroll for more topics →
Make something click.
Made an explainer, or found one you love? Give it a place in the collection.