Engineering · Interactive demo
Why does an electric car charge fast to 80%, then crawl to full?
Fill a battery and watch charging power fall as it fills, then plan a road trip with a few long stops or several short ones.
Created by ExplainerTools.
About this explainer
- Made by
- ExplainerTools
- Format
- Interactive demo
- Subject
- Engineering
- Where it runs
- Plays here
- Full tool
- Open the tool page
- Published
- Added to collection
- electric vehicles
- battery charging
- lithium-ion batteries
- road trips
How the model works
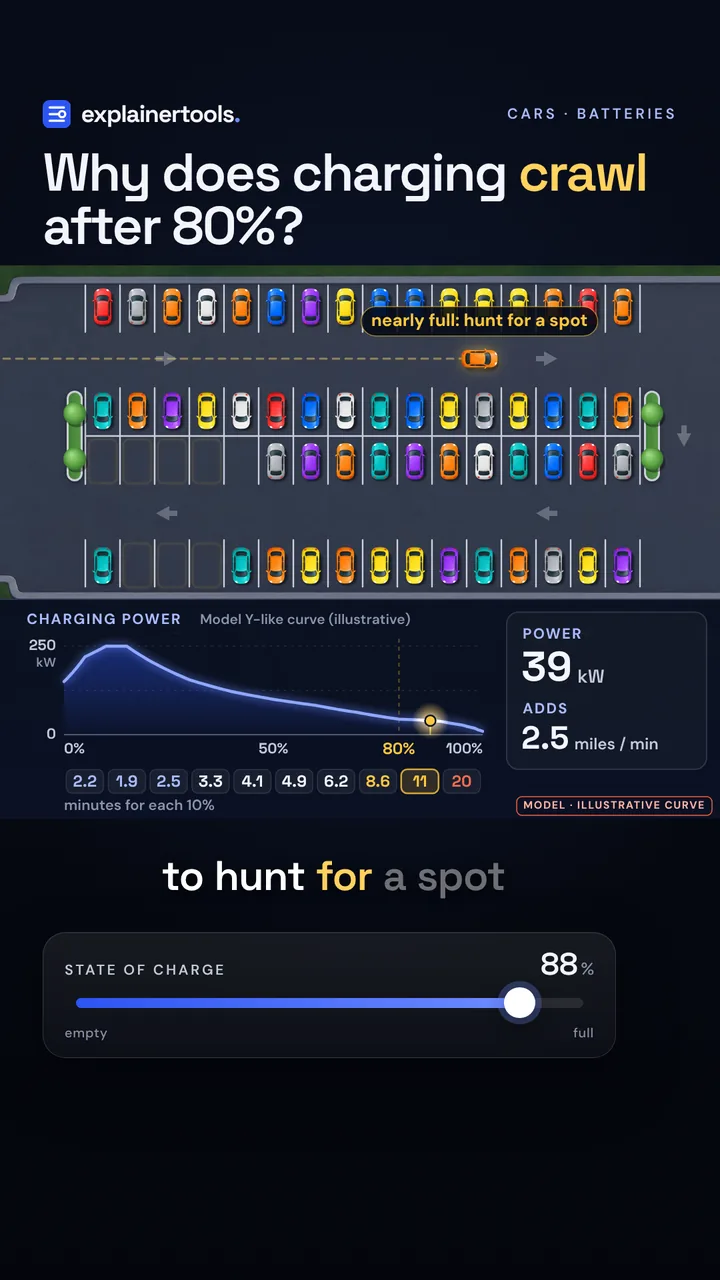
An electric car races from 10% to 80% in about half an hour, then needs about as long again for the last 20%. Why does charging slow down near full?
- State of chargeempty → full
- Road trip: charge toshort stops → fill up
- Charger power50 kW → 250 kW
Presets Arrive 10%, leave 80%Fill to 100% every stopShort hops: 10→50%Old 50 kW charger
An illustrative Model Y–like power curve fitted to measured 10–80% and 80–100% times, a 75 kWh pack and a fixed stop overhead; real curves vary with temperature, charger and software.
Model notes and sources
The power curve. Charging power P(s) is drawn for a Model Y-like car on a 250 kW charger, with s the state of charge. It is log-linear between these illustrative points: 150 kW at 0%, 220 kW at 5%, 250 kW from 10% to 15%, 212 kW at 20%, 155 kW at 30%, 122 kW at 40%, 100 kW at 50%, 83 kW at 60%, 63 kW at 70%, 44 kW at 80%, 37.5 kW at 90%, 27.5 kW at 95% and 9.5 kW at 100%. The time for any window is t = ∫ E / P(s) ds, with E = 75 kWh usable. The points were fitted to the measured times rather than to any one published power trace: the model gives 10→80% in 31.5 min and 80→100% in 31.0 min, against EVKX's Model Y Long Range figures of 32 min 1 s and about 31 min (its 10→100% time minus its 10→80% time). Charging losses are folded into the curve. The Charger power control caps P at the charger's limit.
Why it slows. A fast charge runs at constant current until the cell nears its top voltage, then at constant voltage with the current falling. Near full there is little room left in the graphite anode, so pushing hard can deposit lithium as metal on the anode instead (lithium plating), which costs capacity and can be a safety risk. Heat and cold make it worse. The battery management system turns the power down to prevent it. The parking lot is Elon Musk's analogy (Joe Rogan Experience #2054, 31 Oct 2023): ions are “trying to find a parking space”; “when the parking lot is empty, they can zip right in there and find a spot”; as it fills “you have to hunt around for a spot”. In the drawing, 64 stalls stand for the anode's capacity. The fraction of stalls filled equals the state of charge, and the lot fills in a fixed order, near the entrance first with some scatter. An arriving car's drive grows as free stalls get scarce, and below about 20% free it circles the lot once. That drive is a picture of the idea, not a model of diffusion.
Miles. 280 miles of highway range at 100% (about 3.7 miles per kWh), so 10→80% adds about 196 miles and 80→100% about 56. “Adds miles / min” is P × 280 / 75 / 60.
The road trip. 600 miles. You leave home full, arrive at every charger at 10% and reach the destination at 10%. Every stop charges to the chosen target except the last, which adds only what is still needed. Each stop also costs 3 min to pull in and plug in. Driving time (about 9 h 15 min at 65 mph) is the same for every plan, so only the charging time is compared. With this curve the total is lowest when charging to about 42% (four stops, about 44 min); it jumps wherever the number of stops changes. Charging to 80% costs about 57 min, and filling to 100% every stop about 78 min. The film compares one 10→100% stop (62 min + 3) with three 10→40% stops (7.7 min + 3 each) for the same 504 miles of driving. Real trips add detours, queues, cold or hot batteries (which can lower the curve), chargers shared between stalls and the wish for a buffer at the destination. A route planner weighs these.
The pictures. The parking lot's plate and toy cars are stylized illustrations; the numbers come from the model. The film also uses three short pieces of real footage, picture only, each credited on screen: the opening shot of a red Model Y being plugged in at a Tesla Supercharger is from a TikTok by Zach Morris (@zacharymorris). Elon Musk is shown on The Joe Rogan Experience #2054 (31 Oct 2023), from a clip posted on X by @NarutoNolimits. The measured curve is Tesla Club India's chart for an MG Tomahawk on a 250 A charger (@TeslaClubIN, 25 Oct 2026; data credited to Amogh Padhye): about 111.5 kW, falling to about 50 kW and then 39 kW near full, 10→80% in 32 min and 10→100% in 56 min.
Sources: EVKX, Tesla Model Y Long Range charging curve (10→80% in 32 min 1 s); Yahoo Finance, Elon Musk explains why charging tapers off (23 Nov 2023; the parking-lot analogy and “getting from 80 to 100 takes about as much time as getting from 0 to 80”); Tesla, Supercharger (“charging above 80 percent is rarely necessary, stops are typically short”) and Supercharging (250 kW peak); Fastned, Everything you always wanted to know about fast charging (why speed drops near 80–90%); Electra, Electric car trip (“two short stops are better than one long one”); Wikipedia, Lithium-ion battery (charging, lithium plating).
An ExplainerTools Original. Concept inspired by Elon Musk’s parking-lot analogy on the Joe Rogan Experience #2054 (2023).
Watch it move
Go deeper
Explore interactive ideas in space, science, math, and more. Try a demo, read an interactive article, watch a short video, and follow what makes you curious.
New Originals
Change one thing and see why.
The three newest models, each with a short film. Watch the question, then play with the answer.


Follow your curiosity
A collection of small doors into big ideas.
Format
Swipe or scroll for more formats →
Subject
Swipe or scroll for more subjects →
Topic
Swipe or scroll for more topics →
Sort by
Rankings count activity here on ExplainerTools. Newest means added to this collection.
Loading collection…
Make something click.
Made an explainer, or found one you love? Give it a place in the collection.