Math explainers
Explore 39 visual explanations across interactive demos, articles, and videos.
- How much can compound interest really grow? by ExplainerTools
- Should you switch doors? by ExplainerTools
- Why is paper so hard to fold more than seven times? by ExplainerTools
- Curves and Surfaces by Bartosz Ciechanowski
- Hexagonal Grids by Amit Patel · Red Blob Games
- The Magnificent 2D Matrix by Nicky Case
- Basic Probability by Seeing Theory
- Probability Distributions by Seeing Theory
- Bayesian Inference by Seeing Theory
- A Visual Exploration of Gaussian Processes by Jochen Görtler, Rebecca Kehlbeck & Oliver Deussen
- The essence of calculus by Grant Sanderson · 3Blue1Brown
- Linear transformations and matrices | Chapter 3, Essence of linear algebra by Grant Sanderson · 3Blue1Brown
- The last IMO problem AI could not solve by Grant Sanderson · 3Blue1Brown
- Lie Theory: A Visual Introduction by Aalok Patwardhan
- Tesseract by Bartosz Ciechanowski
- Probability and Games: Damage Rolls by Amit Patel · Red Blob Games
- Curved Paths by Amit Patel · Red Blob Games
- Markov Chains explained visually by Setosa (Explained Visually)
- Eigenvectors and Eigenvalues explained visually by Setosa (Explained Visually)
- Principal Component Analysis explained visually by Setosa (Explained Visually)
- Conditional probability explained visually by Setosa (Explained Visually)
- Circles Sines and Signals by Jack Schaedler
- Regression Analysis by Seeing Theory
- The Hairy Ball Theorem by Grant Sanderson · 3Blue1Brown
- Laplace Transform: forced oscillators by Grant Sanderson · 3Blue1Brown
- Reinventing Entropy | Compression is Intelligence Part 1 by Grant Sanderson · 3Blue1Brown
- How to Integrate with an AX? The Surprising Power of Planimeters by Mathologer (Burkard Polster)
- The jumping frog puzzle by Michael Moor
- Limits Explained Visually by Sam (Sam_Axiom)
- Why do sunflower seeds form spirals? by ExplainerTools
- Keep squaring and adding. Does it escape? by ExplainerTools
- How many riffles mix a deck? by ExplainerTools
- Erdős–Rényi Graphs by Nehal Udyavar · Newt Interactive
- Compound Probability by Seeing Theory
- Frequentist Inference by Seeing Theory
- Drawing Bézier Curves by Bartosz Ciechanowski
- Fourier Series by Paul Falstad
- Visualizing Quaternions by Ben Eater
- How does a seat become a view? by ExplainerTools
See how the world works.
Explore interactive ideas in space, science, math, and more. Try a demo, read an interactive article, watch a short video, and follow what makes you curious.
New Originals
Change one thing and see why.
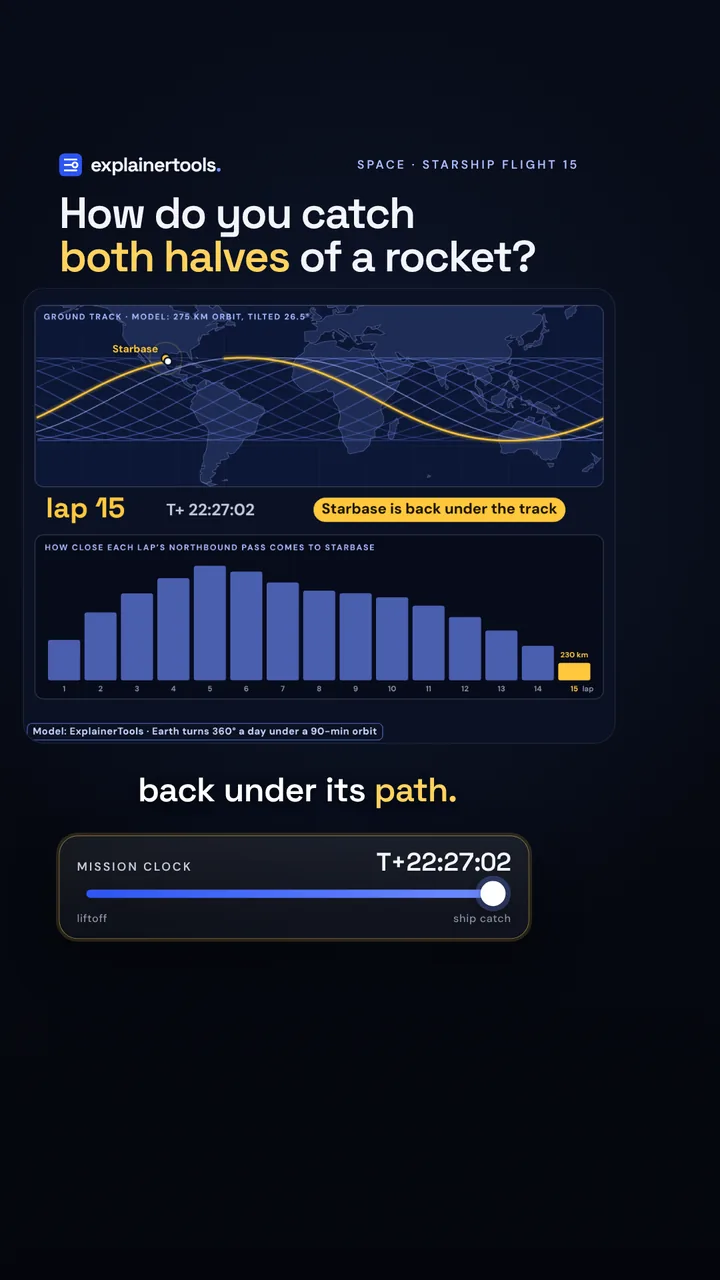
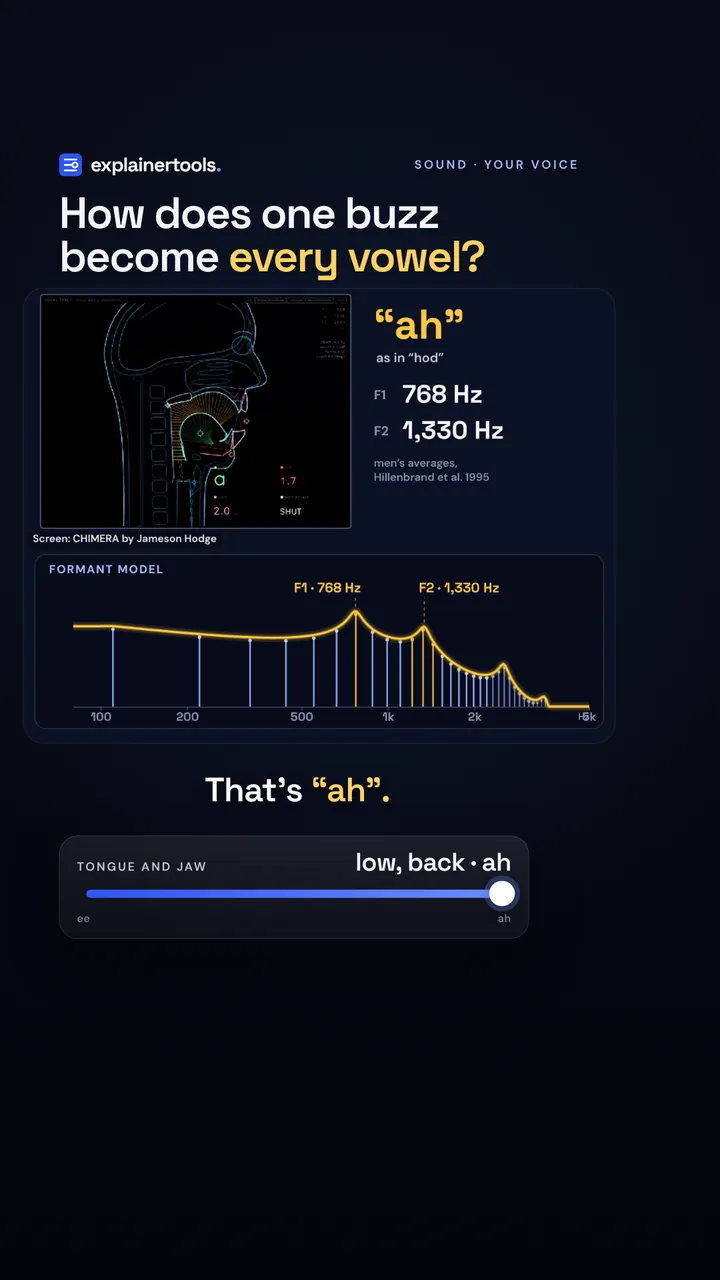
The three newest models, each with a short film. Watch the question, then play with the answer.

Follow your curiosity
A collection of small doors into big ideas.
Format
Swipe or scroll for more formats →
Subject
Swipe or scroll for more subjects →
Topic
Swipe or scroll for more topics →
Sort by
Rankings count activity here on ExplainerTools. Newest means added to this collection.
Loading collection…
Opening the collection…
Make something click.
Made an explainer, or found one you love? Give it a place in the collection.