Economics · Interactive demo
Why does a $5 latte earn ten cents?
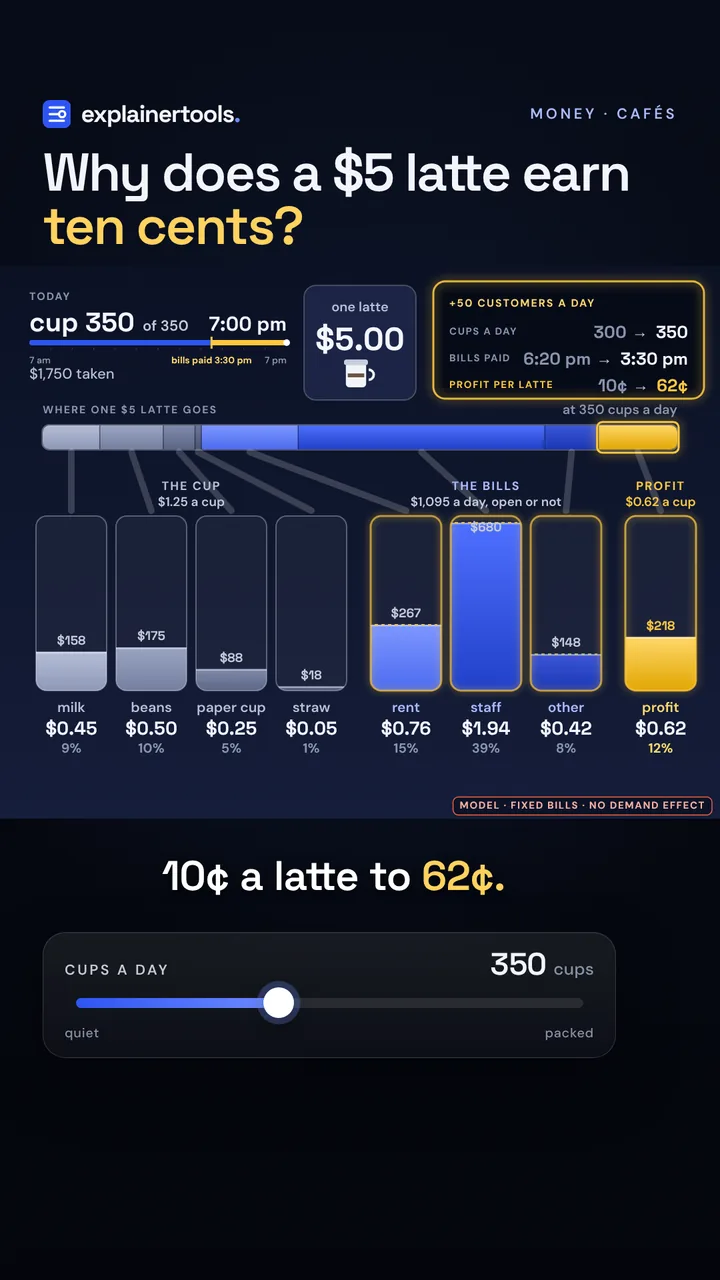
Sort each $5 latte into milk, beans, cup, straw, rent, staff and profit, then add customers and watch the profit jar fill.
Created by ExplainerTools.
About this explainer
- Made by
- ExplainerTools
- Format
- Interactive demo
- Subject
- Economics
- Where it runs
- Plays here
- Full tool
- Open the tool page
- Published
- Added to collection
- cafés
- break-even
- fixed costs
- operating leverage
- small business
How the model works
Every latte brings in $5. Rent, staff and the lights cost the same whether anyone walks in. Why does a café earn nothing until the evening?
- Cups a dayquiet → packed
- Price of a latte$3 → $8
- Rentside street → Midtown
One product, fixed daily bills and no demand effect of price; rent $8,000 a month, staff $680 and other $148 a day, cup cost $1.25. Illustrative inputs, not a forecast for any café.
Model notes and sources
Model. One New York café, one product. Each cup has a variable cost V = $1.25: milk $0.45, beans $0.50, paper cup and lid $0.25, straw $0.05. The daily bills F are rent ÷ 30 (rounded to the dollar) + staff $680 (34 barista-hours at $20) + other $148 (utilities, insurance, software, card terminal, waste). Daily profit = Q(P − V) − F, and break-even cups a day = F ÷ (P − V). At the defaults ($5.00, 300 cups, $8,000 rent) the bills are $1,095 a day, break-even is exactly 292 cups, and the last 8 cups leave $30 for the day: ten cents a latte. Add 50 customers and profit is $217.50 a day, 62 cents a latte. The containers in the stage share one money scale, so their levels compare directly. The clock. Cups do not arrive evenly, so the counter turns "cup n of Q" into a time of day on a typical café day, 7 am to 7 pm: 9% of the day's cups in the first hour, 38% by 10 am, 65% by 1 pm, 87% by 4 pm, the morning rush that owners and baristas describe. At 300 cups the bills are paid at 6:20 pm; at 350 they are paid at 3:30 pm, and the rest of the afternoon is profit. The hourly shares are an assumption, not a measurement; change them in the source and every time moves. The film's real footage, shown as short credited excerpts: a latte poured behind the bar at LB Coffee on the Upper East Side by @lbcoffeenyc, a barista's day at a café in New Rochelle, New York by @romerosaarah, and a former West Village coffee shop listed at $19,000 a month by @capstonepropertiesny. The numbers come from the model, not from the clips.
Not modeled. Price does not change how many people come (no demand curve), staff hours do not rise with volume, and card fees are folded into "other". Food, pastries, other drinks, taxes, waste, discounts, loan payments and seasonality are left out. The numbers are illustrative inputs you can change; they are not a forecast for any real café.
Sources. Contribution-margin and break-even accounting, as in any managerial-accounting text: Break-even (economics) and Operating leverage. The New York inputs are rounded from café owners' own numbers in the footage research: a 405 sq ft shop doing about $20,000 a month at roughly 180–200 drinks on a weekday and about 400 on a weekend day, with ingredients near 35% and labor near 25% of sales (@sidewalkapp owner interviews); rents from about $3,000 a month for 400 sq ft to $19,000 for a former West Village coffee shop (@capstonepropertiesny); barista postings around $20–32 an hour; and lattes commonly $6–8 in Manhattan (The New York Times on Café Grumpy). The $5 price keeps the arithmetic simple; drag the price knob to $7 to see a Manhattan latte.
An ExplainerTools Original.
Watch it move
- Why does a $5 latte earn ten cents?42-second Short
Go deeper
Explore interactive ideas in space, science, math, and more. Try a demo, read an interactive article, watch a short video, and follow what makes you curious.
New Originals
Change one thing and see why.
The three newest models, each with a short film. Watch the question, then play with the answer.
Follow your curiosity
A collection of small doors into big ideas.
Format
Swipe or scroll for more formats →
Subject
Swipe or scroll for more subjects →
Topic
Swipe or scroll for more topics →
Sort by
Rankings count activity here on ExplainerTools. Newest means added to this collection.
Loading collection…
Make something click.
Made an explainer, or found one you love? Give it a place in the collection.