Economics · Interactive demo
Why does the national debt snowball?
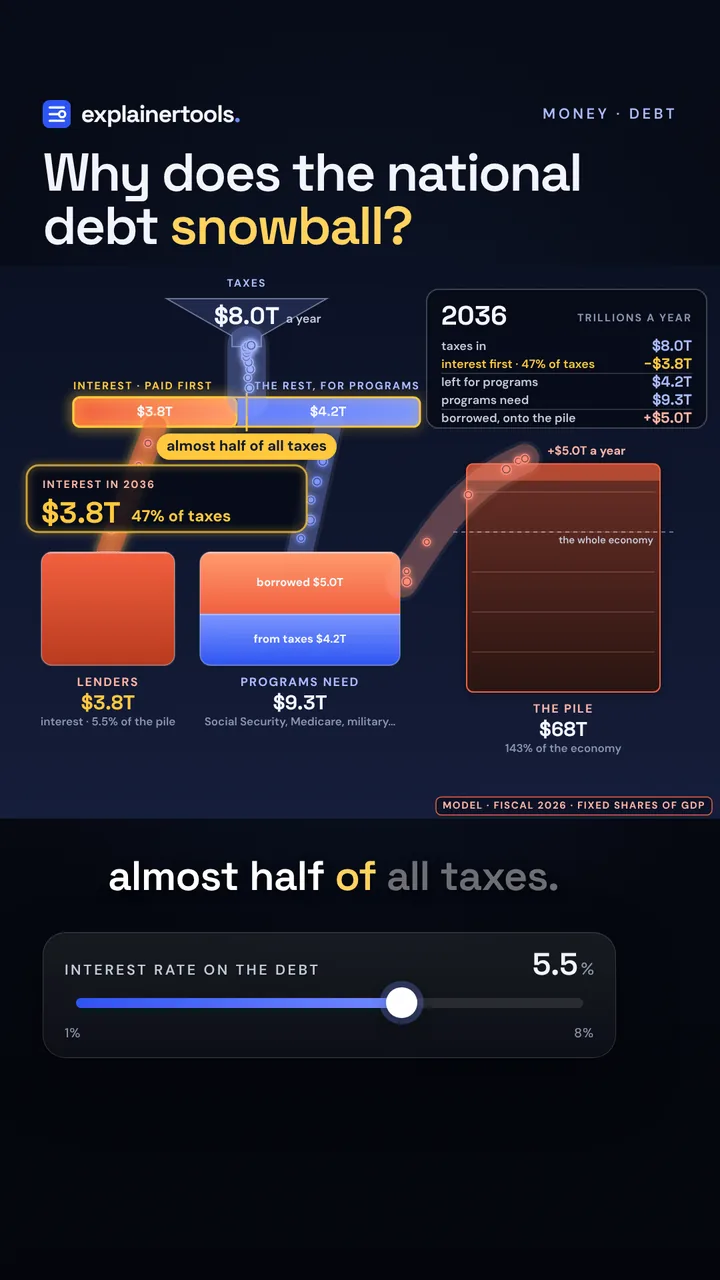
Interest comes off the top, the shortfall is borrowed onto the pile. Turn the interest rate, growth and the spending gap and run the US debt from 2026 to 2056.
Created by ExplainerTools.
About this explainer
- Made by
- ExplainerTools
- Format
- Interactive demo
- Subject
- Economics
- Where it runs
- Plays here
- Full tool
- Open the tool page
- Published
- Added to collection
- national debt
- interest
- deficits
- Ray Dalio
- debt cycles
How the model works
In fiscal 2026 the United States paid $1.14 trillion in interest, more than it spent on the military. Why does the pile keep growing faster?
- Interest rate on the debt1% → 8%
- Economic growth0% → 7%
- Spending beyond taxessurplus → big deficit
Fiscal 2026 shares of GDP held fixed, 4% nominal growth, one average rate on the whole pile; the 2036 figures are the model's, not a forecast.
Model notes and sources
Model. One country, one year at a time, in trillions of dollars. Taxes are 16.7% of GDP and spending before interest is 19.3% of GDP, which reproduces fiscal 2026: receipts $5.4T, outlays $7.4T, deficit $2.0T on a GDP of about $32.4T. The pile is debt held by the public, $32.4T, about 100% of GDP. Each year, interest = rate × pile, and it is paid before anything else; what is left of taxes goes to programs; borrowing = spending − taxes + interest, the shortfall after interest; the pile grows by the borrowing; GDP grows at the growth knob (nominal, so inflation is inside it). The default 3.5% rate reproduces the $1.14T of net interest paid in 2026 ($1.13T in the model). The snowball has two engines: the gap before interest, and the difference between the interest rate and growth. When the rate is above growth, the pile outgrows the economy even with no gap. The film opens on the National Debt Clock in Manhattan, by @newyorkcityclocks; the clock shows gross federal debt, including what the government owes its own trust funds, while the pile in the model is debt held by the public. The numbers come from the model, not from the clip.
Not modeled. The shares of GDP stay fixed, so no policy changes, recessions, inflation surprises or changes in who holds the debt. The average rate on the whole pile moves at once in this model; in reality new rates apply as old bonds roll over, which takes years. The 2036 figures in the film are this model's projection at a 5.5% rate, two points above today's, not a forecast.
Sources. Congressional Budget Office, Monthly Budget Review: September 2026 (fiscal 2026 receipts $5,403B, outlays $7,396B, deficit $1,993B, net interest $1,143B, defense $916B, Social Security $1,654B, Medicare $1,069B, Medicaid $723B); American Action Forum on the Treasury's final Monthly Treasury Statement for fiscal 2026 (debt held by the public about $32.4T, about 100% of GDP; interest about 19% of revenue); the debt-dynamics identity Δ(debt/GDP) ≈ (r − g)·(debt/GDP) + primary deficit, as in any public-finance text (Wikipedia). Concept inspired by Ray Dalio's How the Economic Machine Works.
An ExplainerTools Original. Concept inspired by Ray Dalio’s How the Economic Machine Works.
Watch it move
- Why does the national debt snowball?45-second Short
Go deeper
- How did $5 billion of debt sink Toys “R” Us?Topic guide
- Why does the national debt snowball?Topic guide
- Why does the national debt snowball?Journal
Explore interactive ideas in space, science, math, and more. Try a demo, read an interactive article, watch a short video, and follow what makes you curious.
New Originals
Change one thing and see why.
The three newest models, each with a short film. Watch the question, then play with the answer.
Follow your curiosity
A collection of small doors into big ideas.
Format
Swipe or scroll for more formats →
Subject
Swipe or scroll for more subjects →
Topic
Swipe or scroll for more topics →
Sort by
Rankings count activity here on ExplainerTools. Newest means added to this collection.
Loading collection…
Make something click.
Made an explainer, or found one you love? Give it a place in the collection.