Economics · Interactive demo
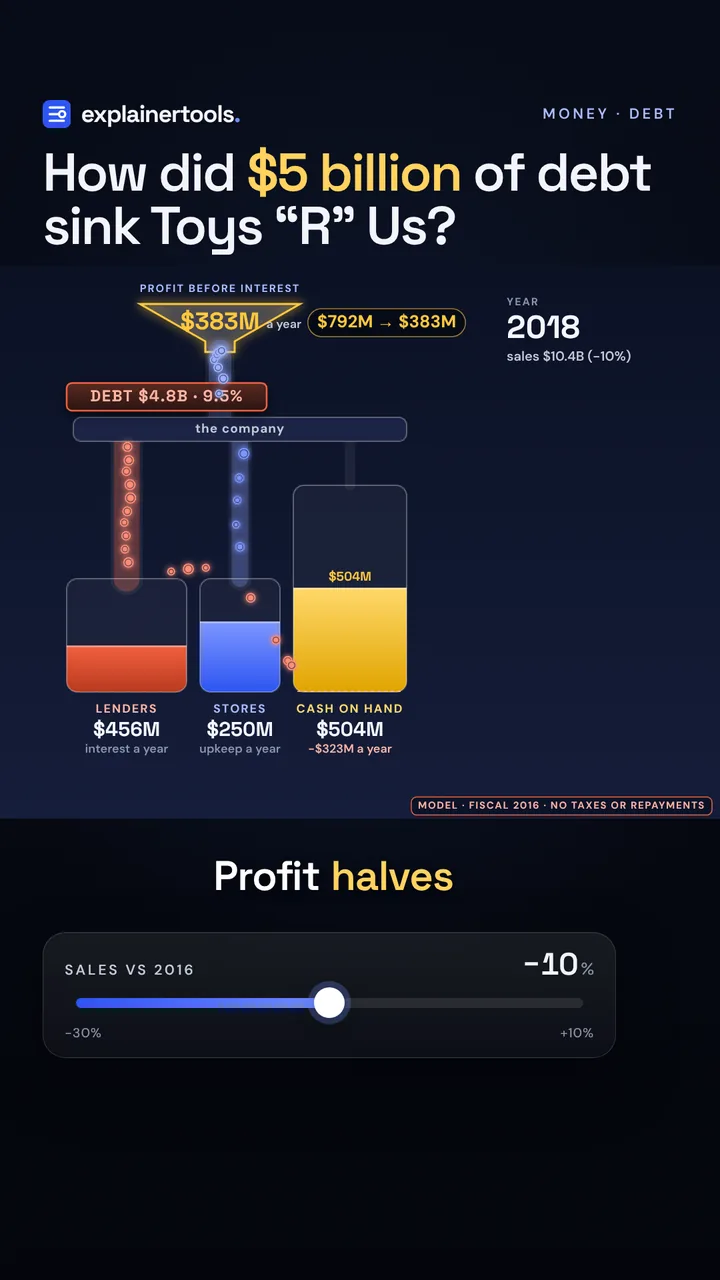
How did $5 billion of debt sink Toys “R” Us?
Drop a buyout's debt on a chain that earns $800M a year, cut sales 10% and watch the cash tank drain.
Created by ExplainerTools.
About this explainer
- Made by
- ExplainerTools
- Format
- Interactive demo
- Subject
- Economics
- Where it runs
- Plays here
- Full tool
- Open the tool page
- Published
- Added to collection
- leveraged buyouts
- private equity
- debt
- Toys R Us
- cash flow
How the model works
In its last full year, Toys “R” Us earned about $800 million before interest. Nine months later it was in Chapter 11. Where did the money go?
- Buyout debtnone → $8B
- Interest rate4% → 14%
- Sales vs 2016−30% → +10%
Fiscal 2016 figures with fixed operating costs; no taxes, working capital or repayments; the 10% sales drop is a what-if.
Model notes and sources
Model. One company, one year at a time, in dollars of fiscal 2016 (ended January 28, 2017). Profit before interest E = sales × 35.4% gross margin − $3.30B of operating costs, which gives the reported Adjusted EBITDA of $792M on $11.54B of sales. Interest I = debt × rate; the defaults, $4.8B at 9.5%, reproduce the reported $457M. Store upkeep K = $250M (capital spending was $252M). Each year the cash tank changes by E − I − K, starting from $566M of cash. The sales knob keeps operating costs fixed, so a 10% fall in sales takes profit before interest from $792M to about $380M: the same operating leverage that runs a café. The film's real footage, shown as short credited excerpts: a Toys “R” Us sign coming down in 2018, by @toysrusarchive. The numbers come from the model, not from the clips.
Not modeled. Taxes, working capital, store closures, asset sales, refinancing and debt repayments are left out, and the real company did not drain in a straight line: it filed for Chapter 11 in September 2017 with about $400M of debt coming due the next year, and liquidated its US stores in 2018. The film's 10% sales drop is a what-if, not the recorded fiscal 2017 result.
Sources. Toys“R”Us, Inc., Results for the Full Year and Fourth Quarter of Fiscal 2016 (net sales $11,540M, operating earnings $460M, Adjusted EBITDA $792M, interest expense $457M, net loss $36M, capital expenditures $252M, cash $566M) and its fiscal 2016 Form 10-K; Fortune, September 18, 2017 (about $5 billion of debt, about $400 million due the next year); Retail Dive on the 2005 $6.6B leveraged buyout by KKR, Bain Capital and Vornado and the roughly $400M a year of debt service; Wikipedia.
An ExplainerTools Original.
Watch it move
- How did $5 billion of debt sink Toys “R” Us?39-second Short
Go deeper
Explore interactive ideas in space, science, math, and more. Try a demo, read an interactive article, watch a short video, and follow what makes you curious.
New Originals
Change one thing and see why.
The three newest models, each with a short film. Watch the question, then play with the answer.
Follow your curiosity
A collection of small doors into big ideas.
Format
Swipe or scroll for more formats →
Subject
Swipe or scroll for more subjects →
Topic
Swipe or scroll for more topics →
Sort by
Rankings count activity here on ExplainerTools. Newest means added to this collection.
Loading collection…
Make something click.
Made an explainer, or found one you love? Give it a place in the collection.